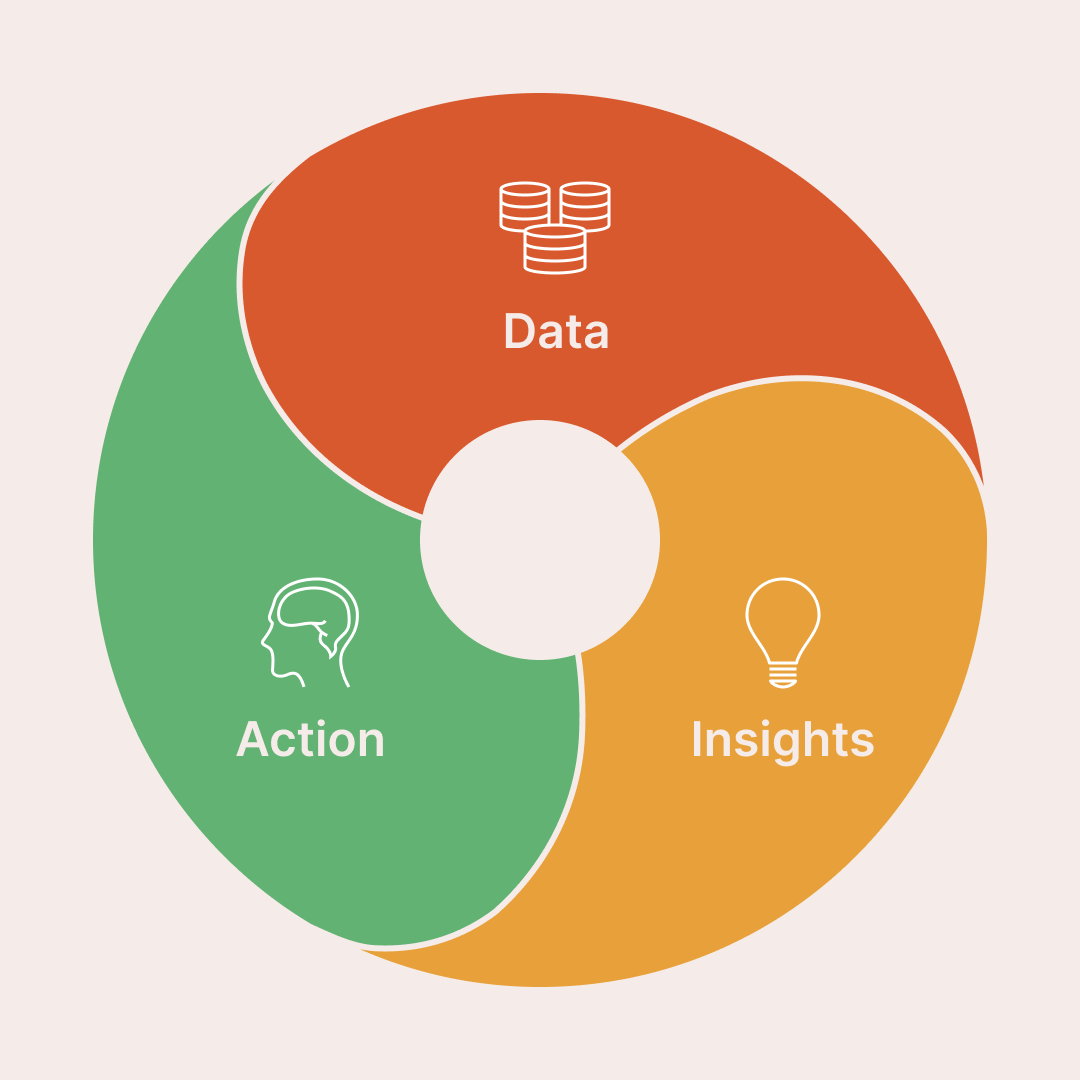
Data, Insights, Action! is a flexible data analytics framework and continuous improvement cycle that illustrates how organizations transform data into informed decisions and measurable outcomes. The diagram represents a closed-loop process where data is collected and analyzed to generate insights, which are then used to drive actions and improvements. The results of those actions create new data, reinforcing an ongoing cycle of learning, optimization, and performance improvement.
This type of data-driven decision-making model is commonly used to explain analytics workflows, business intelligence processes, product optimization cycles, and operational feedback loops. Because the diagram is fully editable, it can be adapted to different industries, teams, and use cases—such as strategy planning, performance management, digital transformation, or experimentation frameworks—while maintaining the same core structure.
By visualizing data, insights, and action as a continuous loop rather than a linear sequence, the diagram emphasizes iteration, feedback, and adaptability. It highlights how value is created through repeated analysis, decision-making, and execution, making it suitable for presentations, product documentation, analytics platforms, and educational content.