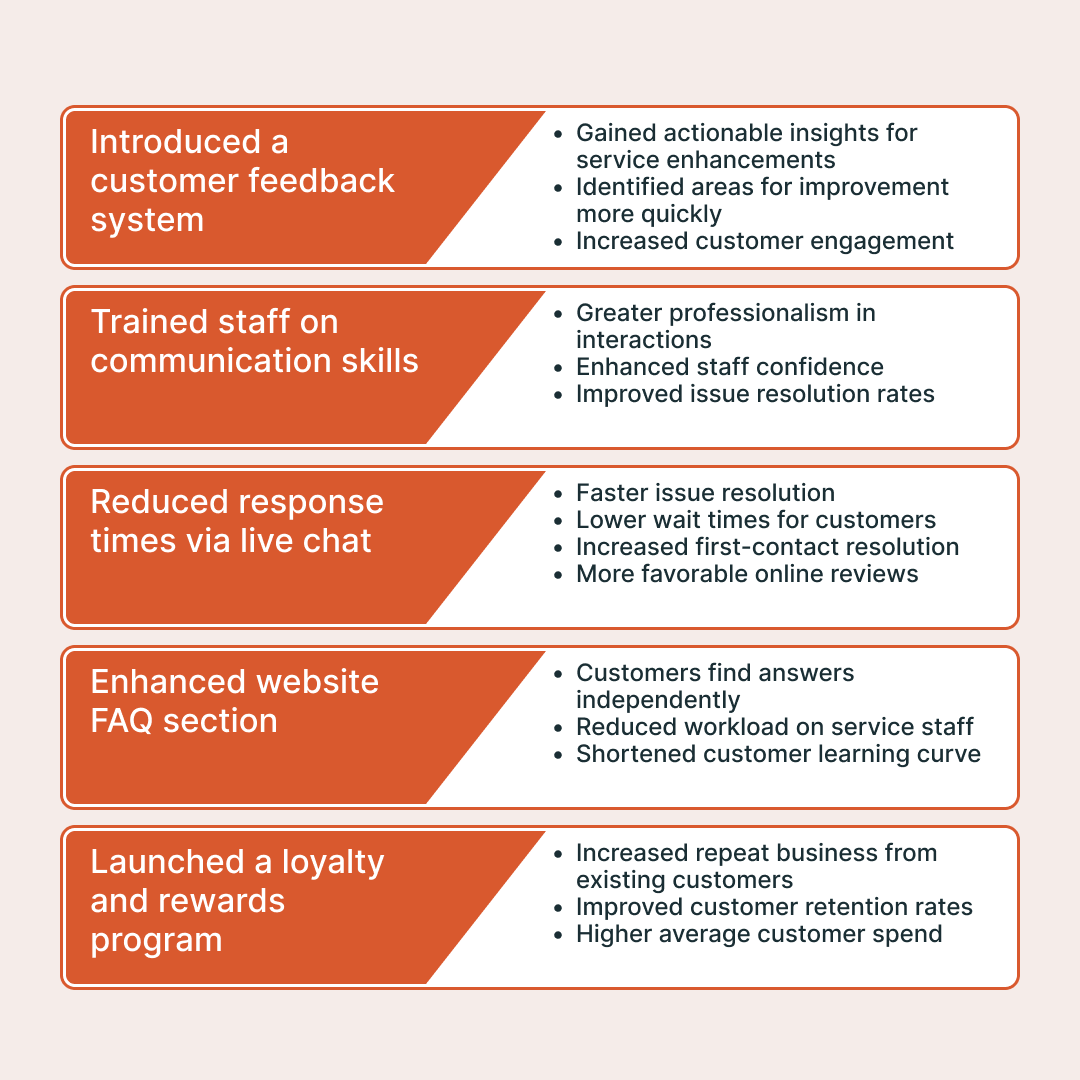
The Cause & Impact Diagram visually maps the relationship between key initiatives (causes) and their resulting outcomes or effects (impacts). It helps users clearly understand how specific actions drive measurable results, making it a powerful tool for strategic planning, problem-solving, and performance tracking. Ideal for business presentations, this diagram simplifies complex cause-and-effect relationships, enabling better decision-making and communication.


.png)


