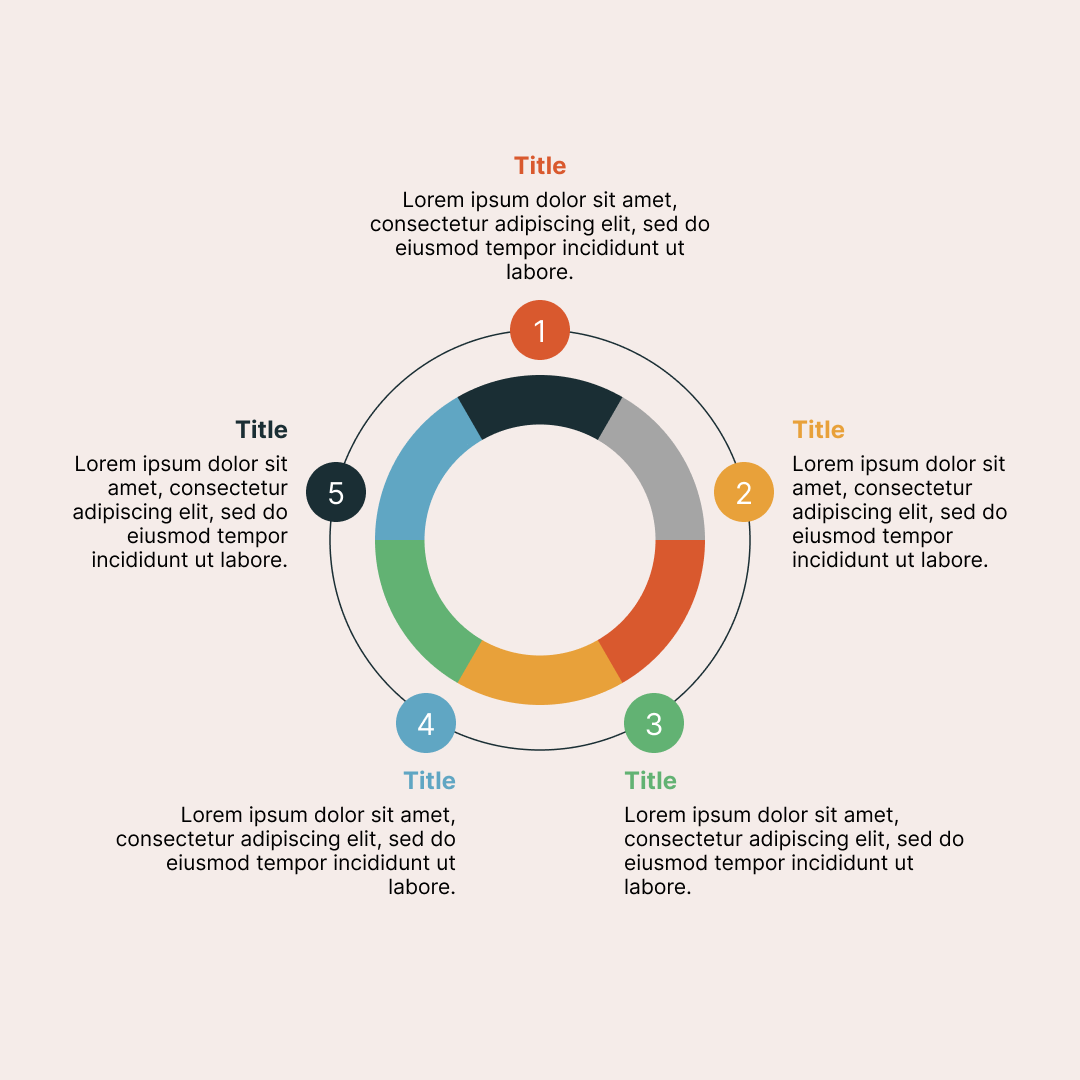
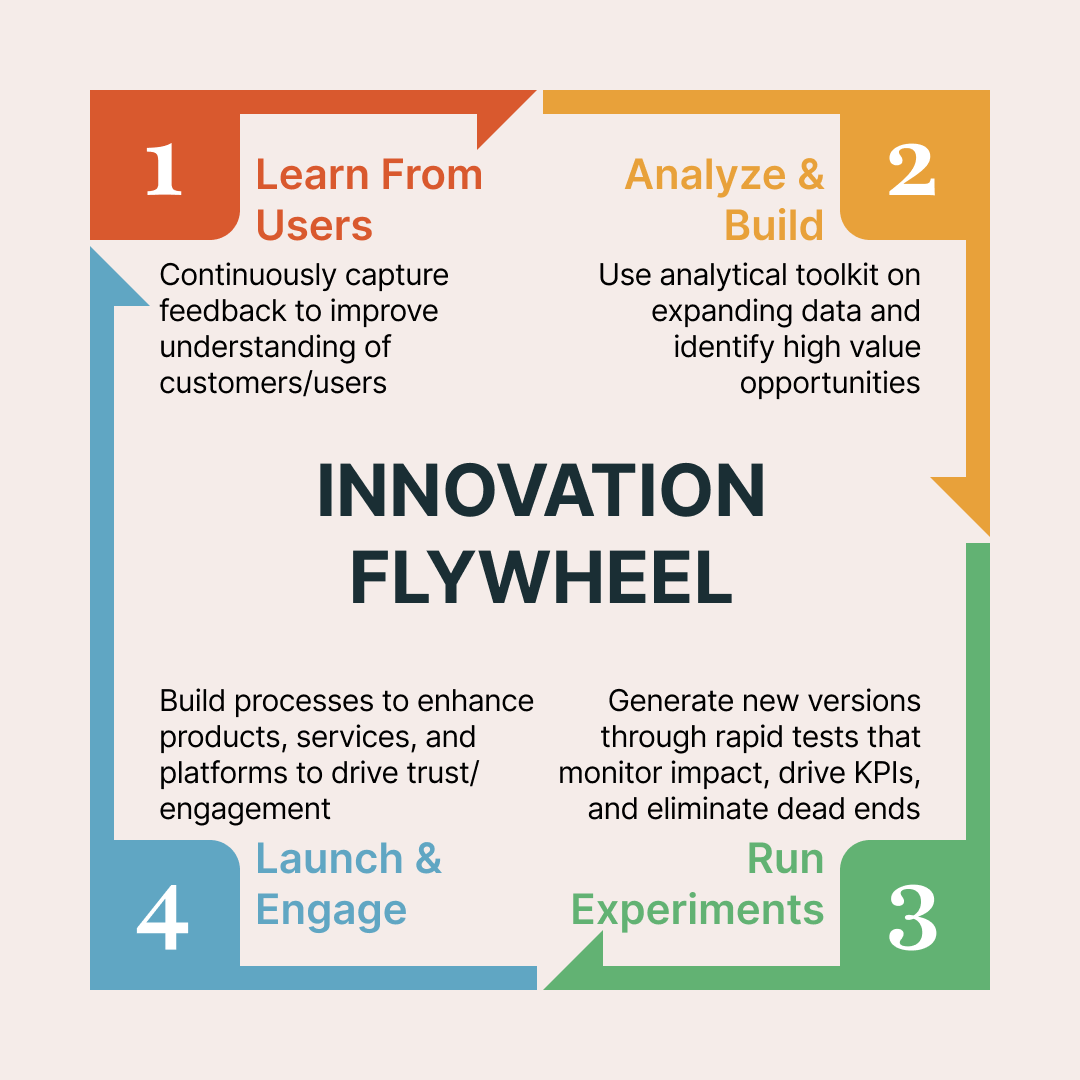
A flywheel diagram is a circular visual that represents cyclical processes or ongoing growth, showing how each step builds momentum and reinforces the next. It’s commonly used in business and project management to illustrate continuous improvement and interconnected workflows.
Why Use a Flywheel Diagram?
This PowerPoint flywheel diagram template is fully editable - you can customize colors, labels, and segments to fit your needs and branding.