All Diagrams
/
Quadrant Puzzle Chart
Free

Quadrant Puzzle Chart

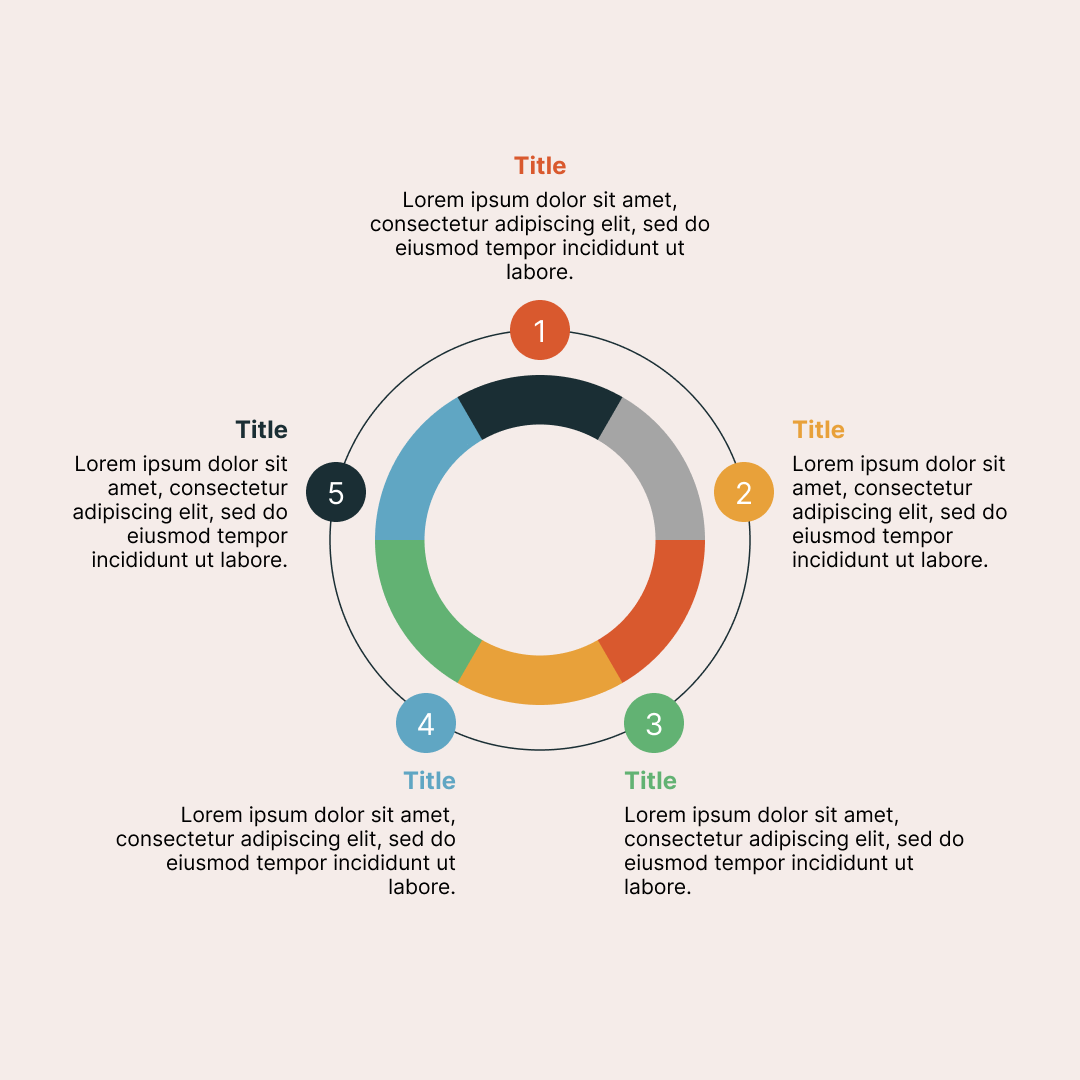
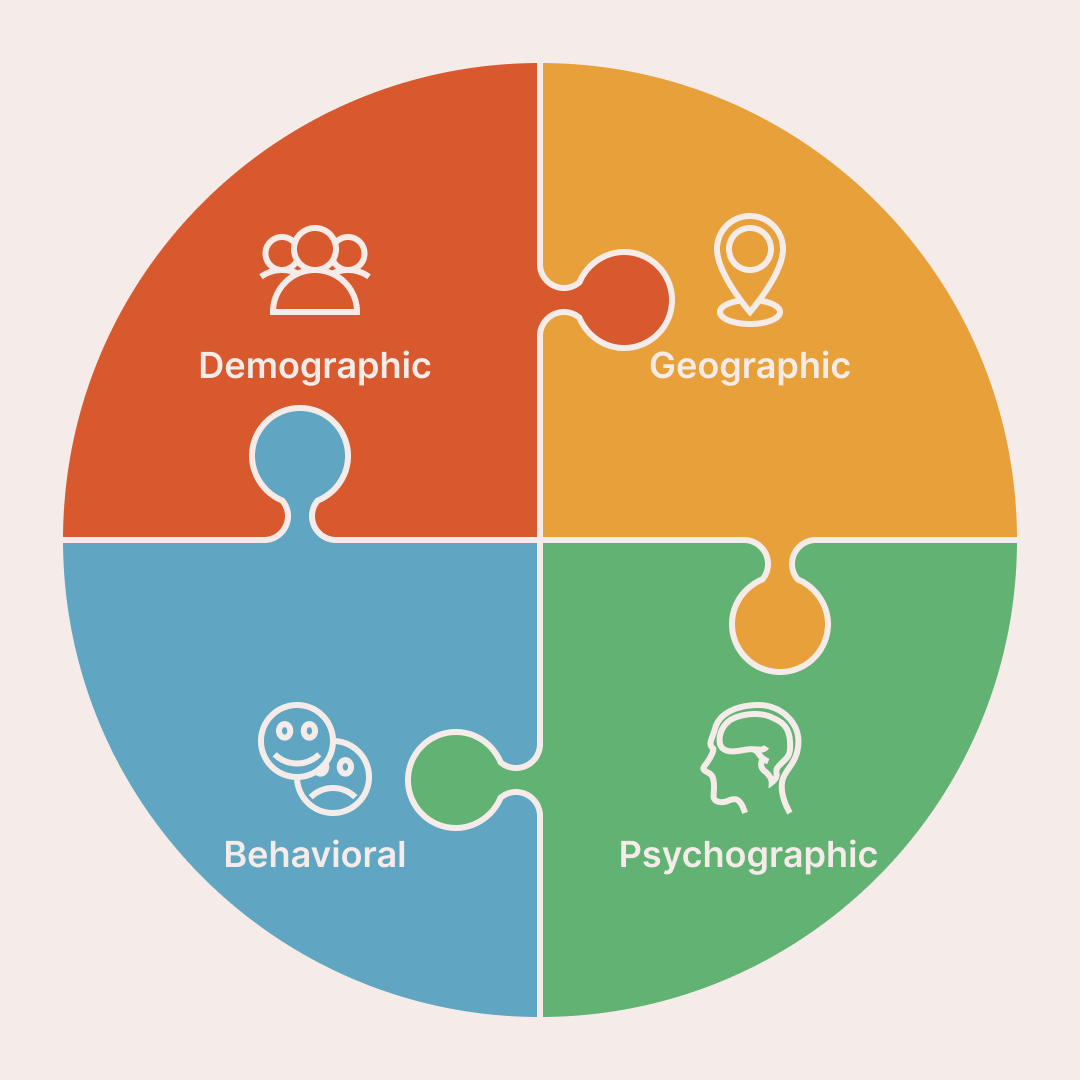
This Quadrant Puzzle Circle PowerPoint template is ideal for visually illustrating how four interconnected elements contribute to a cohesive whole. Its puzzle-piece design makes it especially effective for scenarios where the synergy and interdependence of components are central to your message.

Use Cases:

  • Business Analysis: Clearly depict four key business drivers, such as time, cost, quality, and scope, to facilitate strategic discussions or project status updates.
  • Market Segmentation: Represent demographic, geographic, behavioral, and psychographic segments, making it easy to communicate how each group influences your overall marketing strategy.
  • Project Management: Break down project phases or milestones, highlighting how each stage—initiation, planning, execution, and closure—interlocks to ensure project success.
  • Strategic Planning: Show how departments or initiatives (like marketing, sales, operations, and finance) align to achieve organizational goals, emphasizing collaboration.
  • Education: Teach concepts that involve four perspectives or variables, such as the BCG Matrix (stars, cash cows, question marks, dogs) or SWOT analysis (strengths, weaknesses, opportunities, threats).
  • Comparative Analysis: Compare four products, services, or competitors, visually organizing similarities and differences to support decision-making.
  • Process Visualization: Map out four-step processes, workflows, or cycles, making complex procedures easier to understand and follow.

This template’s visual clarity and adaptability make it a powerful tool for presentations across business, education, strategy, and research contexts, helping you communicate complex, interconnected ideas with impact.

by
Slideck.co